Observability
Overview
As part of the AlphaSense product installation, a telemetry collector and storage system have been included for auditing and troubleshooting purposes. This system collects essential insights through logs, metrics, and traces. Grafana acts as the central hub, providing a single point of access to this telemetry data.
This documentation is designed to help you effectively use Grafana within the AlphaSense product. Whether you're new or experienced with the platform, our goal is to guide utilizing Grafana for monitoring, troubleshooting, and decision-making in the context of your AlphaSense product experience.
Accessing Grafana
Prerequisite
- kubectl command line tool. At least version v1.25.16 is required
Create an ingress for Grafana
Use the following example to create ingress for Grafana. Skip in case Ingress cannot be created for e.g. security reasons.
apiVersion: networking.k8s.io/v1
kind: Ingress
metadata:
kubernetes.io/ingress.class: nginx-v2
labels:
app.kubernetes.io/instance: kube-prometheus-stack
app.kubernetes.io/name: grafana
name: kube-prometheus-stack-grafana
namespace: monitoring
spec:
rules:
- host: grafana.<domain name>
  http:
  paths:
  - backend:
    service:
    name: kube-prometheus-stack-grafana
    port:
    number: 80
    path: /
    pathType: Prefix
    tls:
- hosts:
  - '*.<domain name>'
    secretName: <tls secret, i.e: star.<domain name>>
Grafana Access Procedures
To access Grafana user interface, please follow these steps:
- Fetch the read-only user password: on the Kubernetes context where the AlphaSense product is deployed, run the following command:
kubectl -n monitoring get secret grafana-readonly-user-secret -o json | jq -r '.data | map_values(@base64d)'
- In case Ingress is not created. Port-forward Grafana service to your local machine: on the Kubernetes context where the AlphaSense product is deployed, run the following command:
kubectl port-forward -n monitoring service/kube-prometheus-stack-grafana 8080:80
- Open a browser and access either the host defined in the Ingress or
http://localhost:8080. The credentials for logging in is:
- Username: alphasense-read
- Password: the output result of step 1
Usage
Grafana Homepage
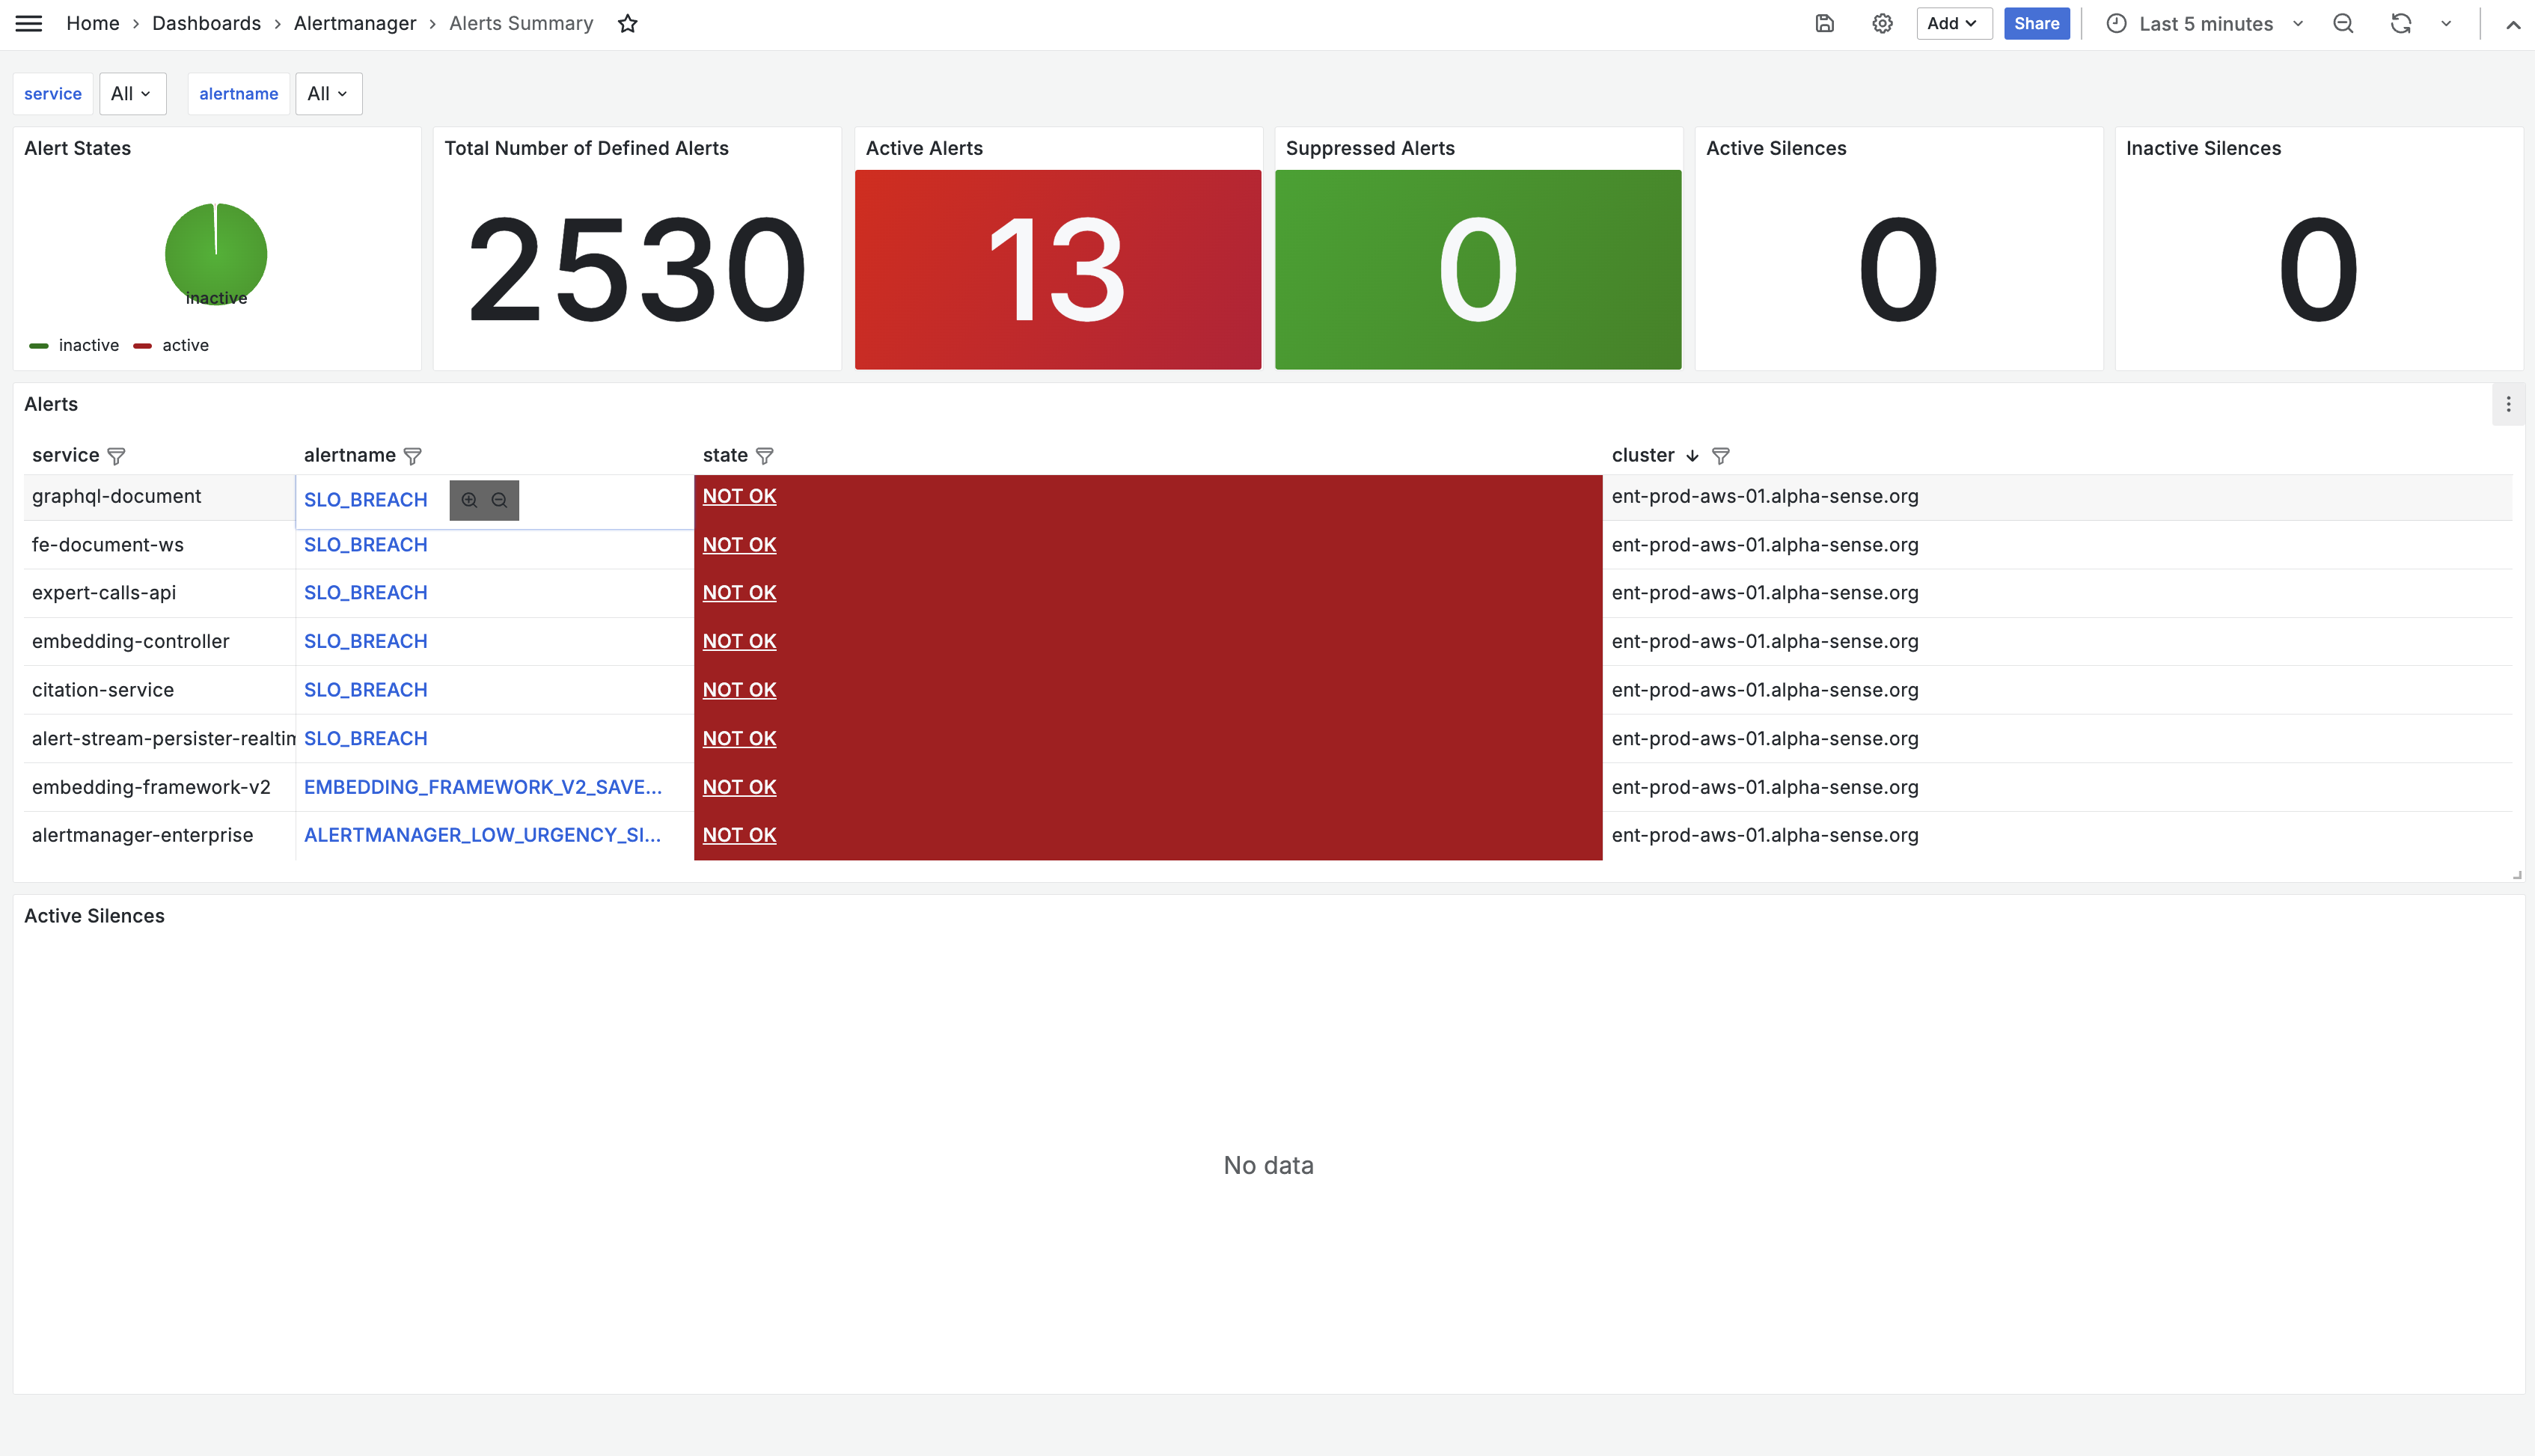
The Grafana homepage serves as a critical health monitoring dashboard, providing real-time visibility into the system's operational status. It features a prominent status indicator that clearly communicates the system's health state:
- Critical Status (Red): Indicates the presence of unhealthy services that require immediate attention. The dashboard displays detailed information about affected services and recommended actions.
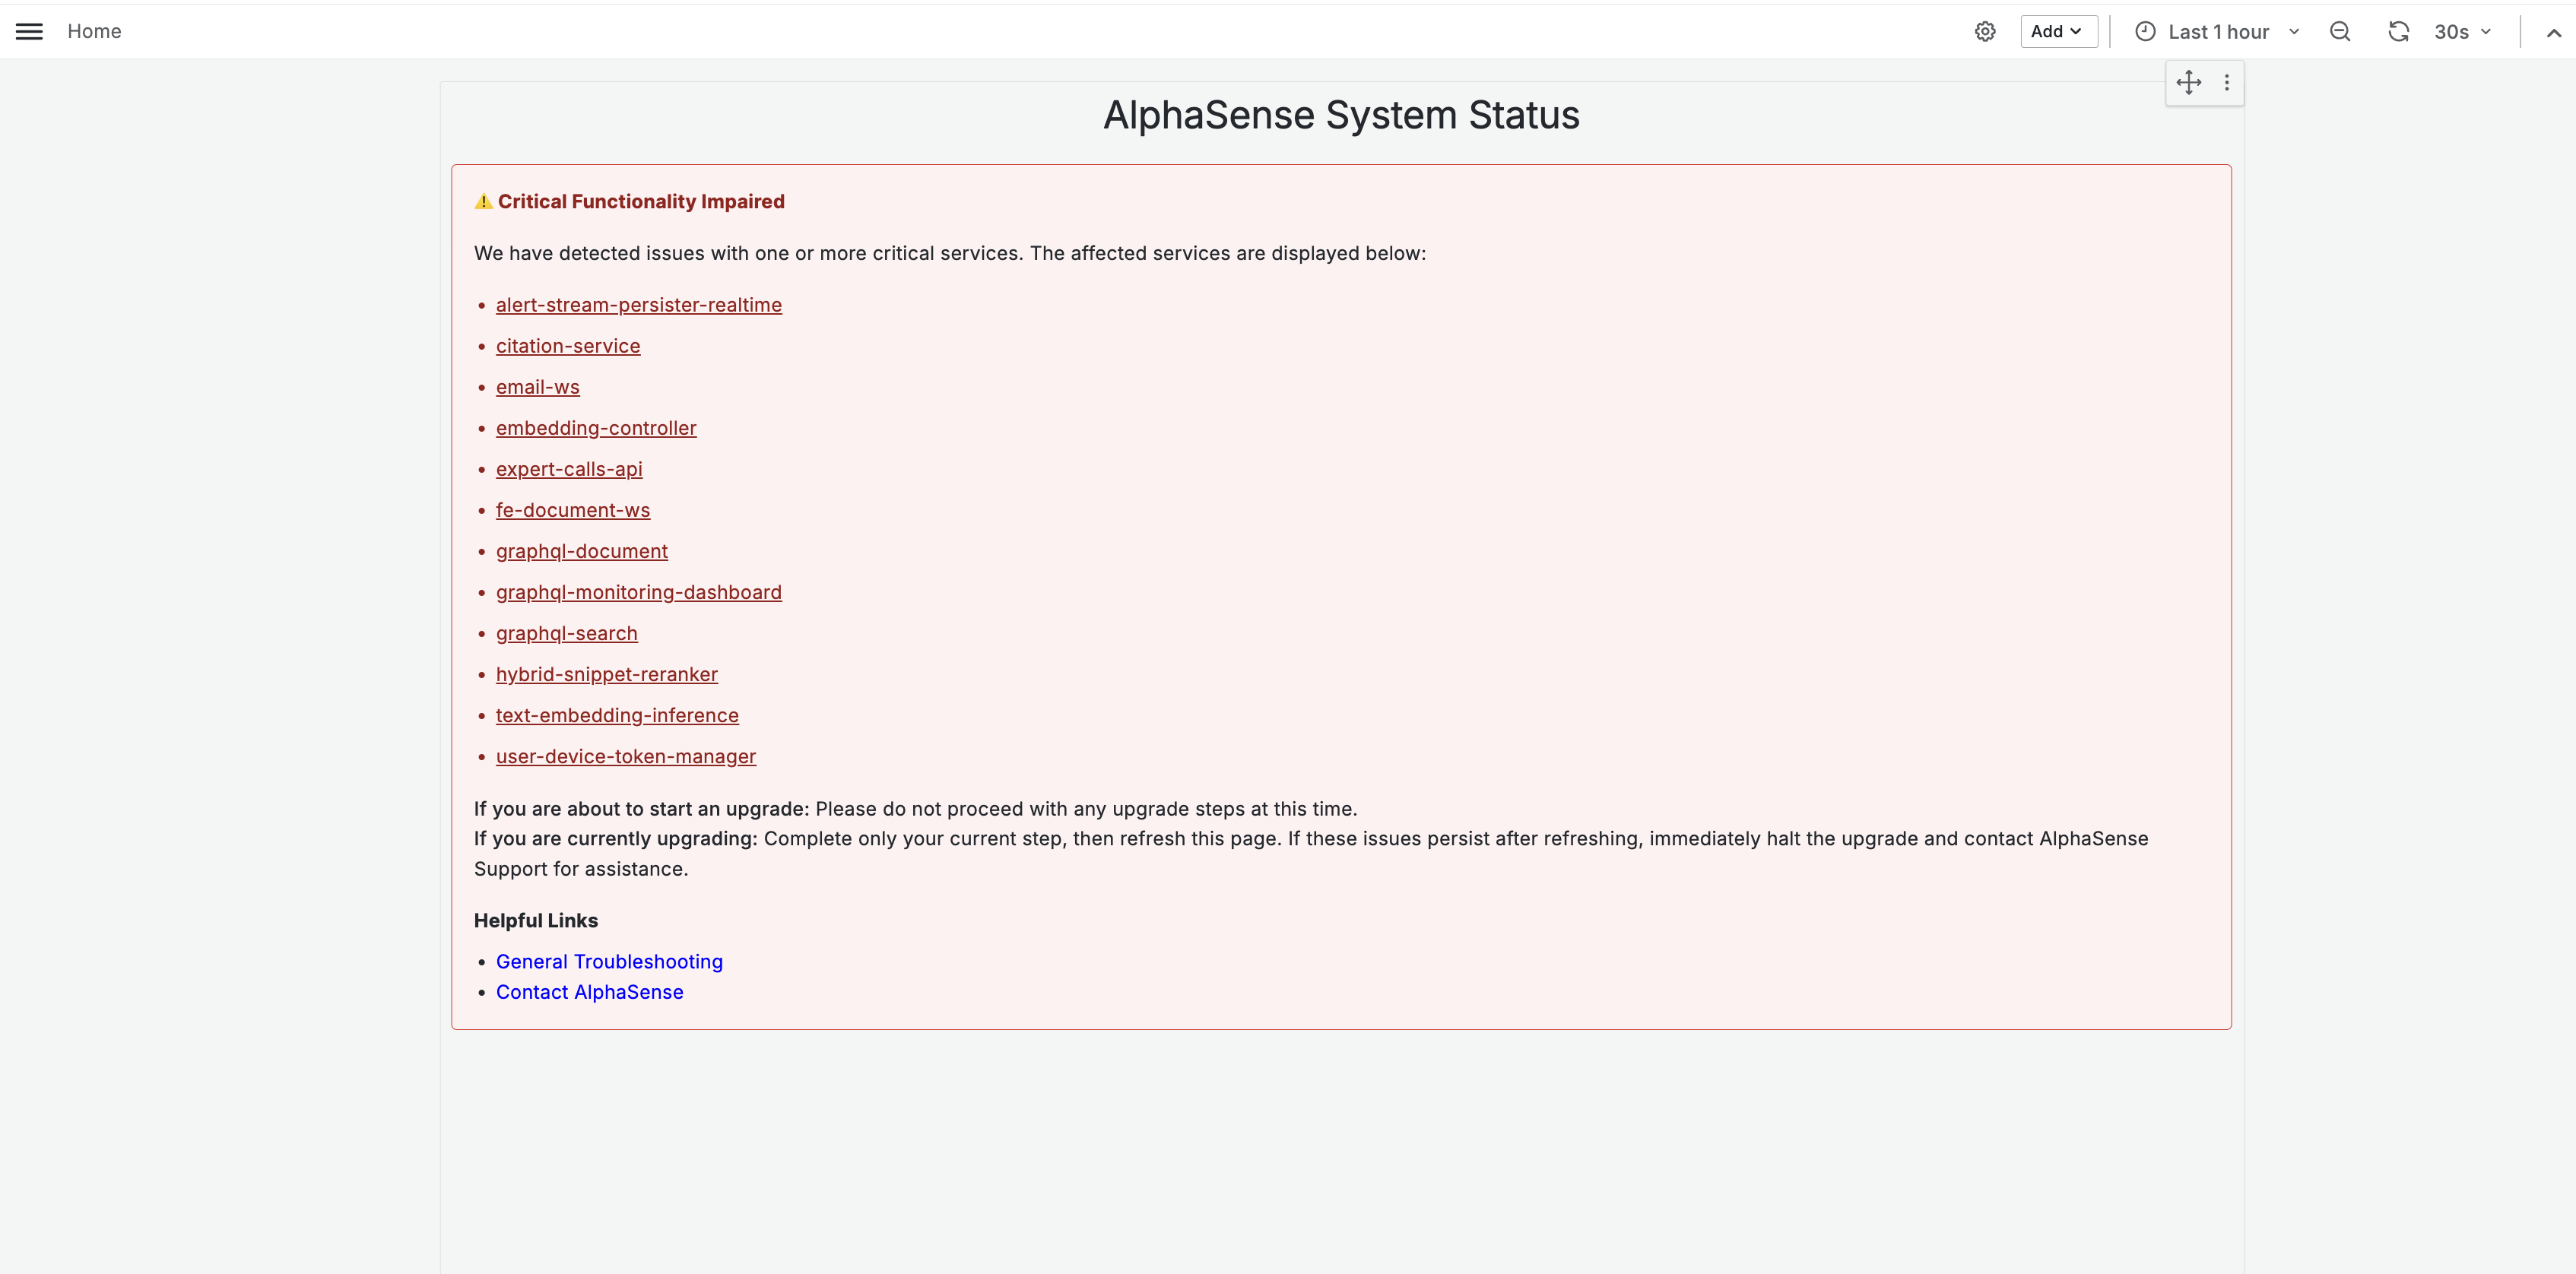
- Healthy Status (Green): Confirms that all monitored services are operating within expected parameters, indicating the system is ready for planned operations.

In addition to the health status dashboard, we provide comprehensive data sources for detailed telemetry analysis. The following sections will guide you through accessing and utilizing these various telemetry data types.
Querying Metrics
We've set up three following data sources:
- Metrics
- Logs
- Traces
Although these sources function similarly, three separate instances exist for technical reasons.
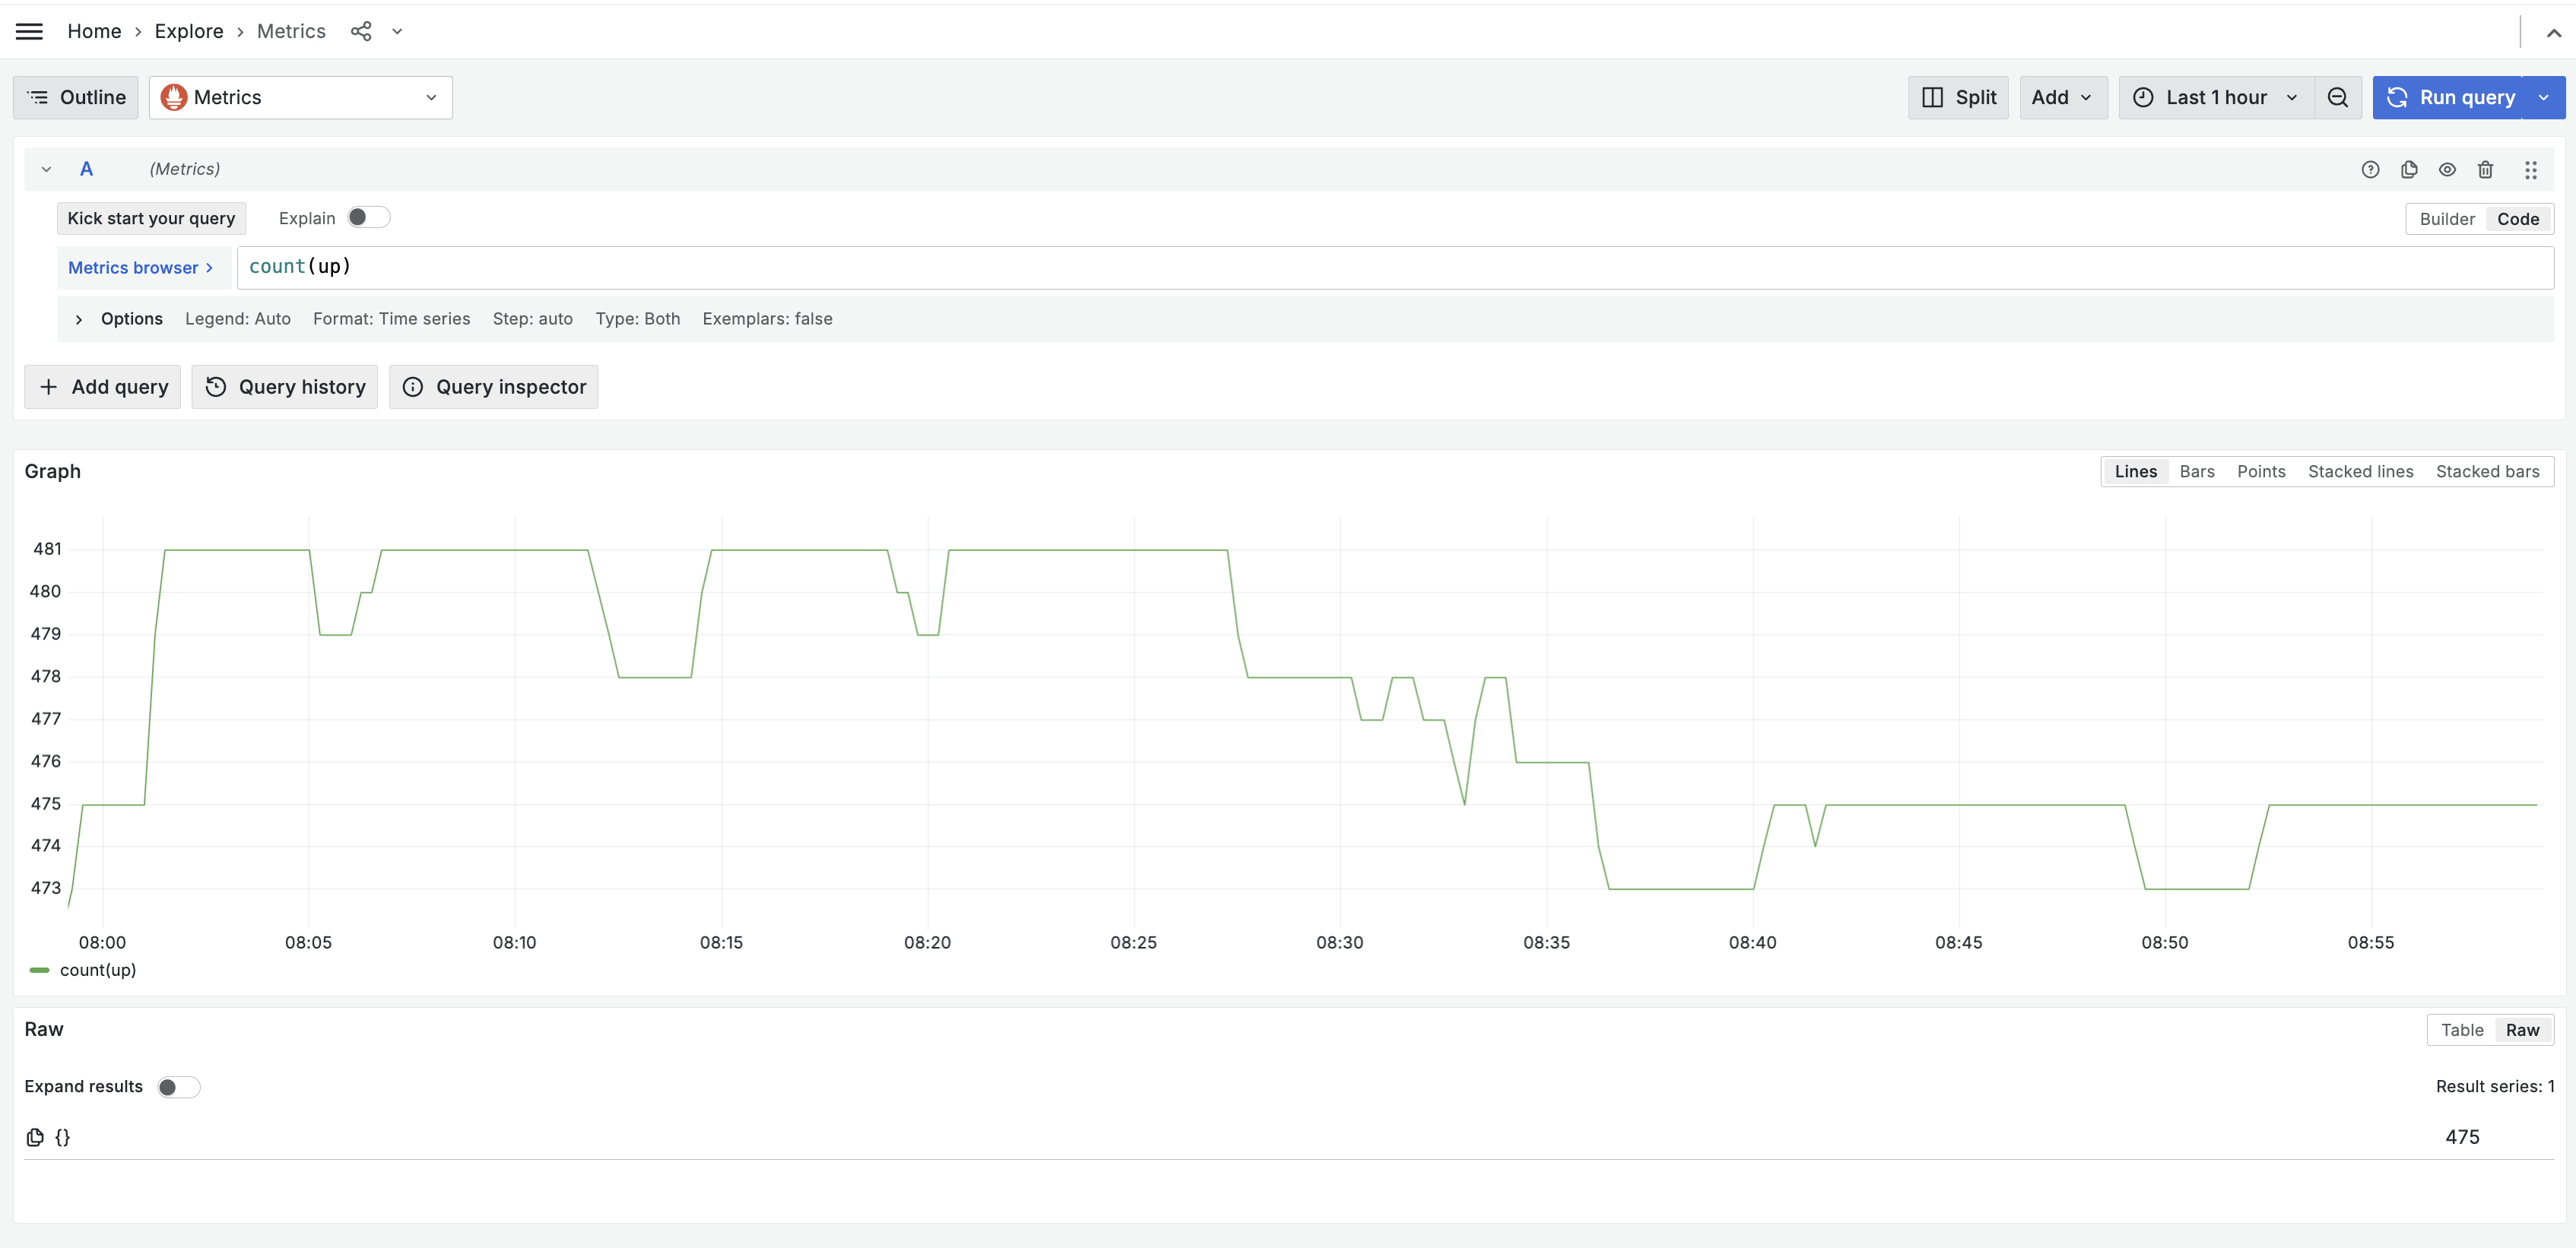
The querying language is PromQL. Full reference for it can be viewed from here reference for it here.
Querying Logs
A single data source named Logs for querying logs can be found in Grafana Explore.
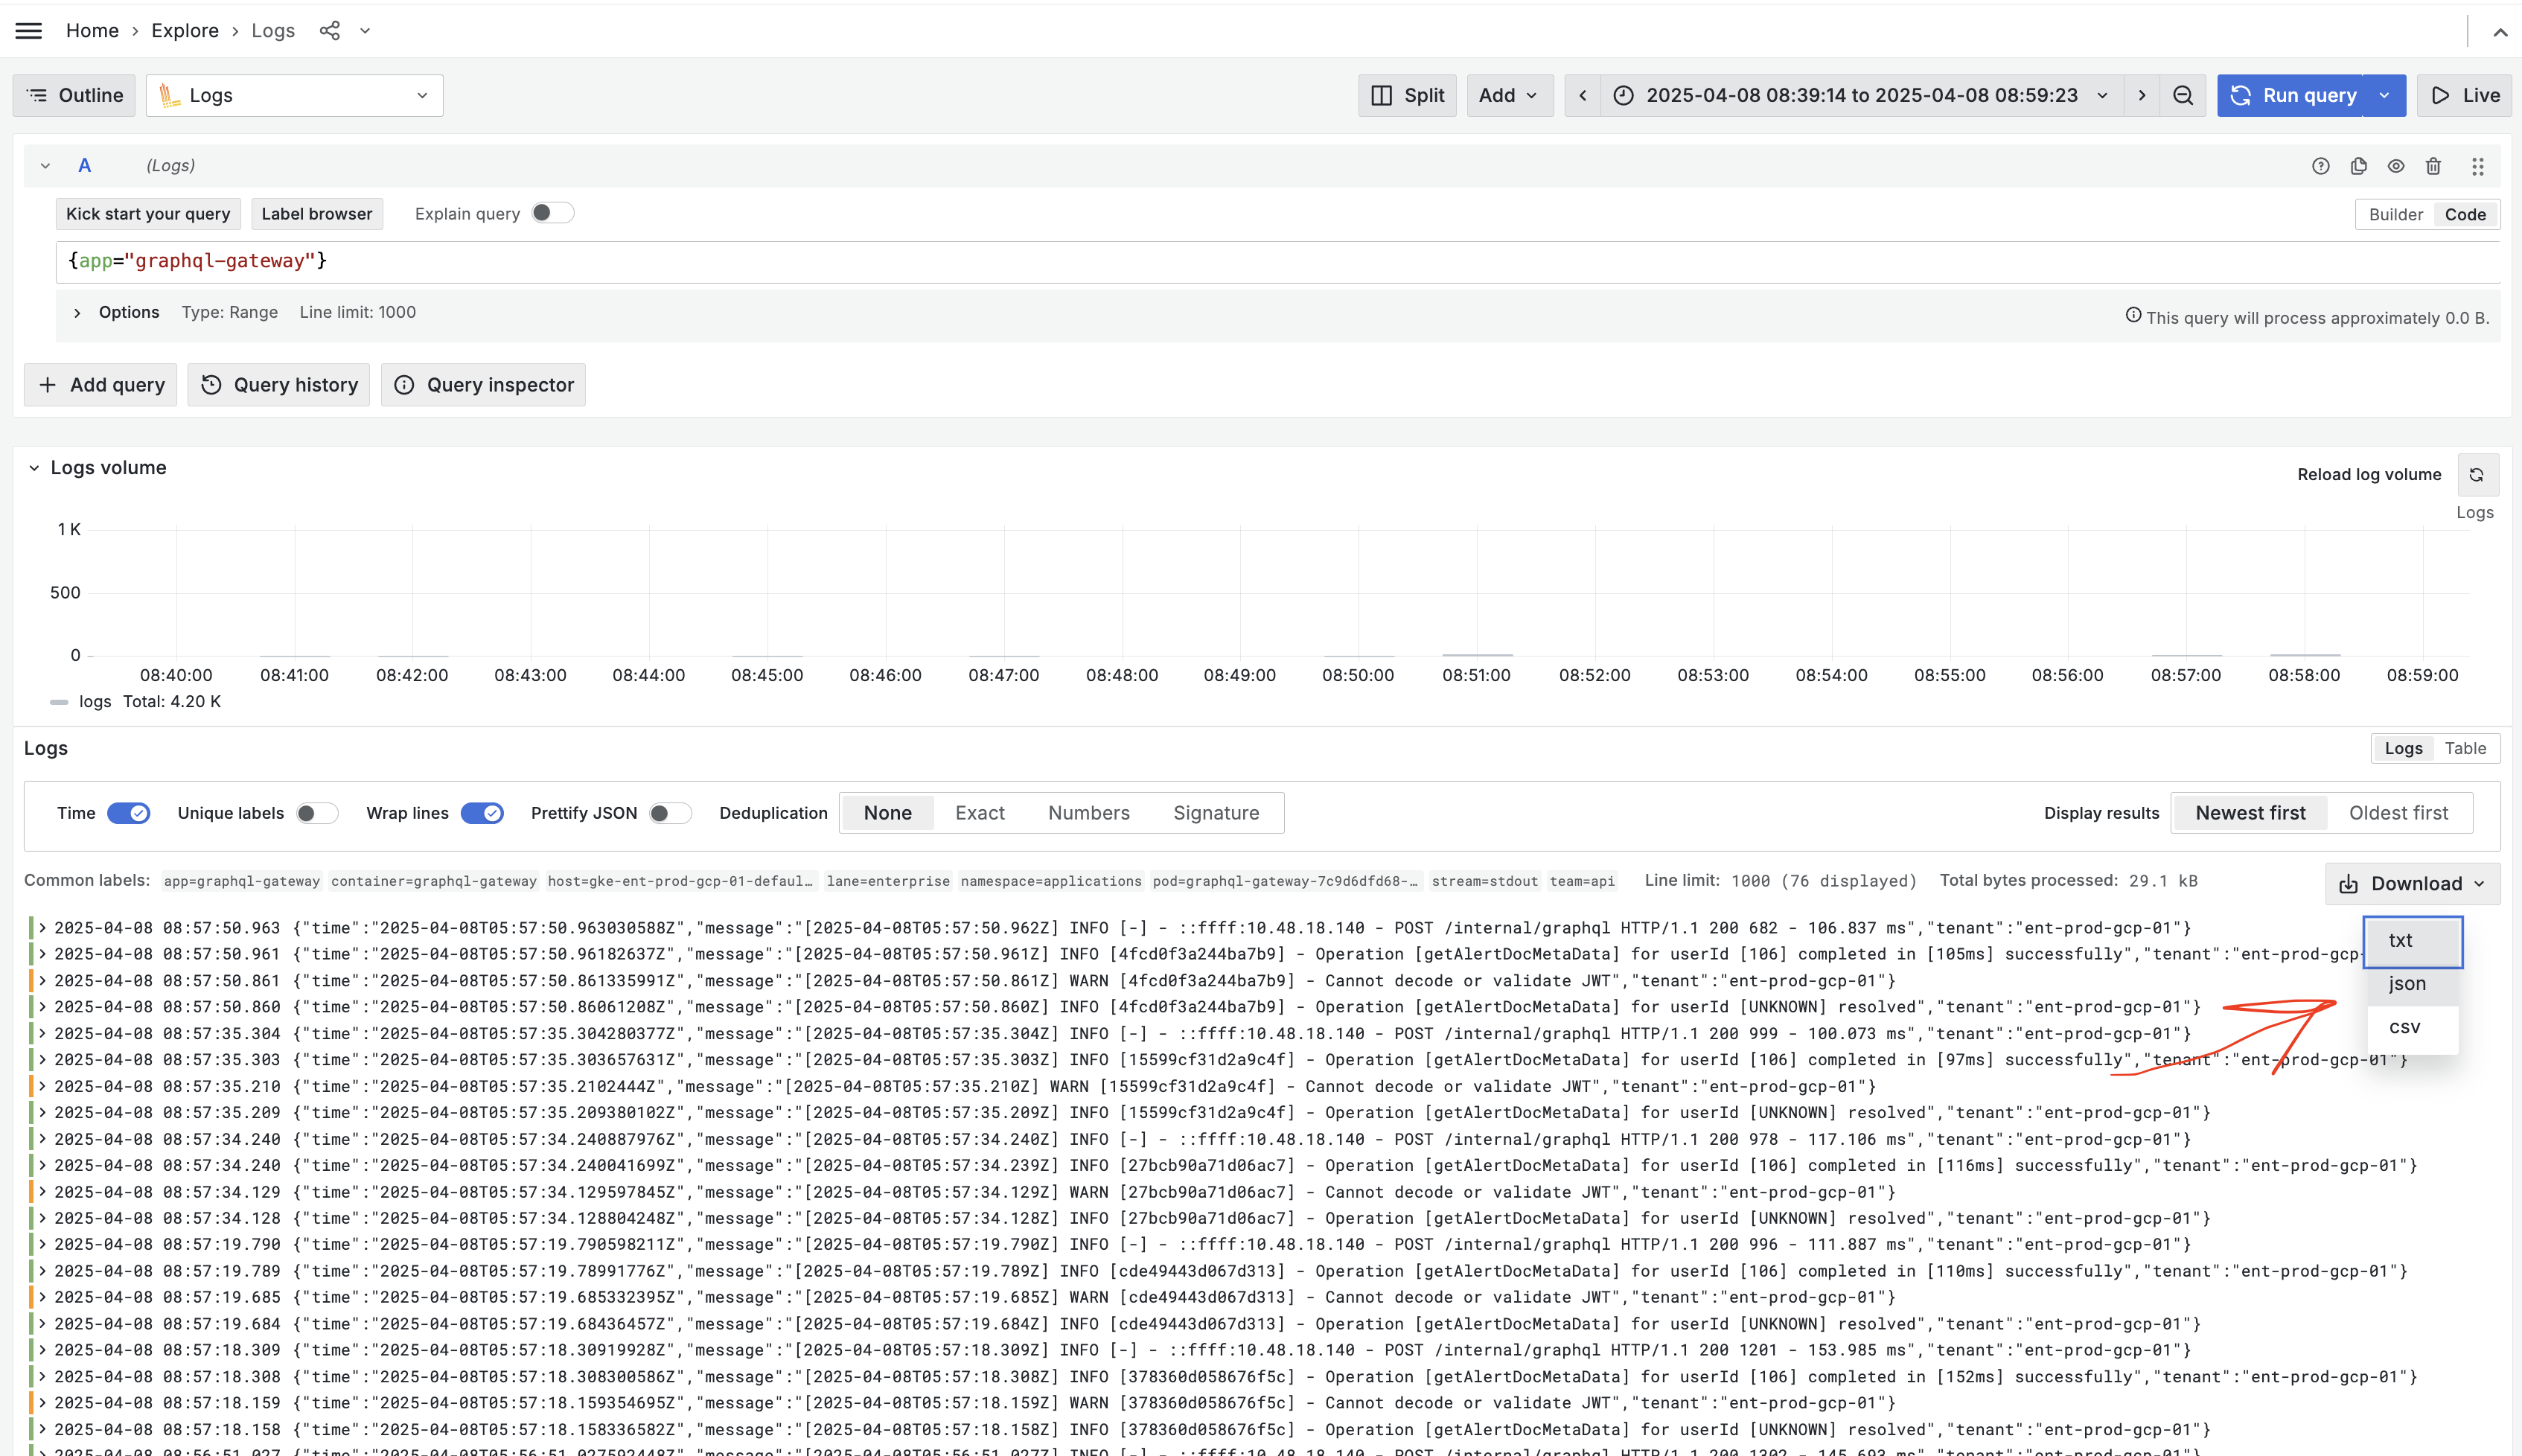
The querying language employed is LogQL. For a comprehensive reference, you can view it here.
Querying Traces
A single data source named Traces for querying application traces can be found in Grafana Explore.
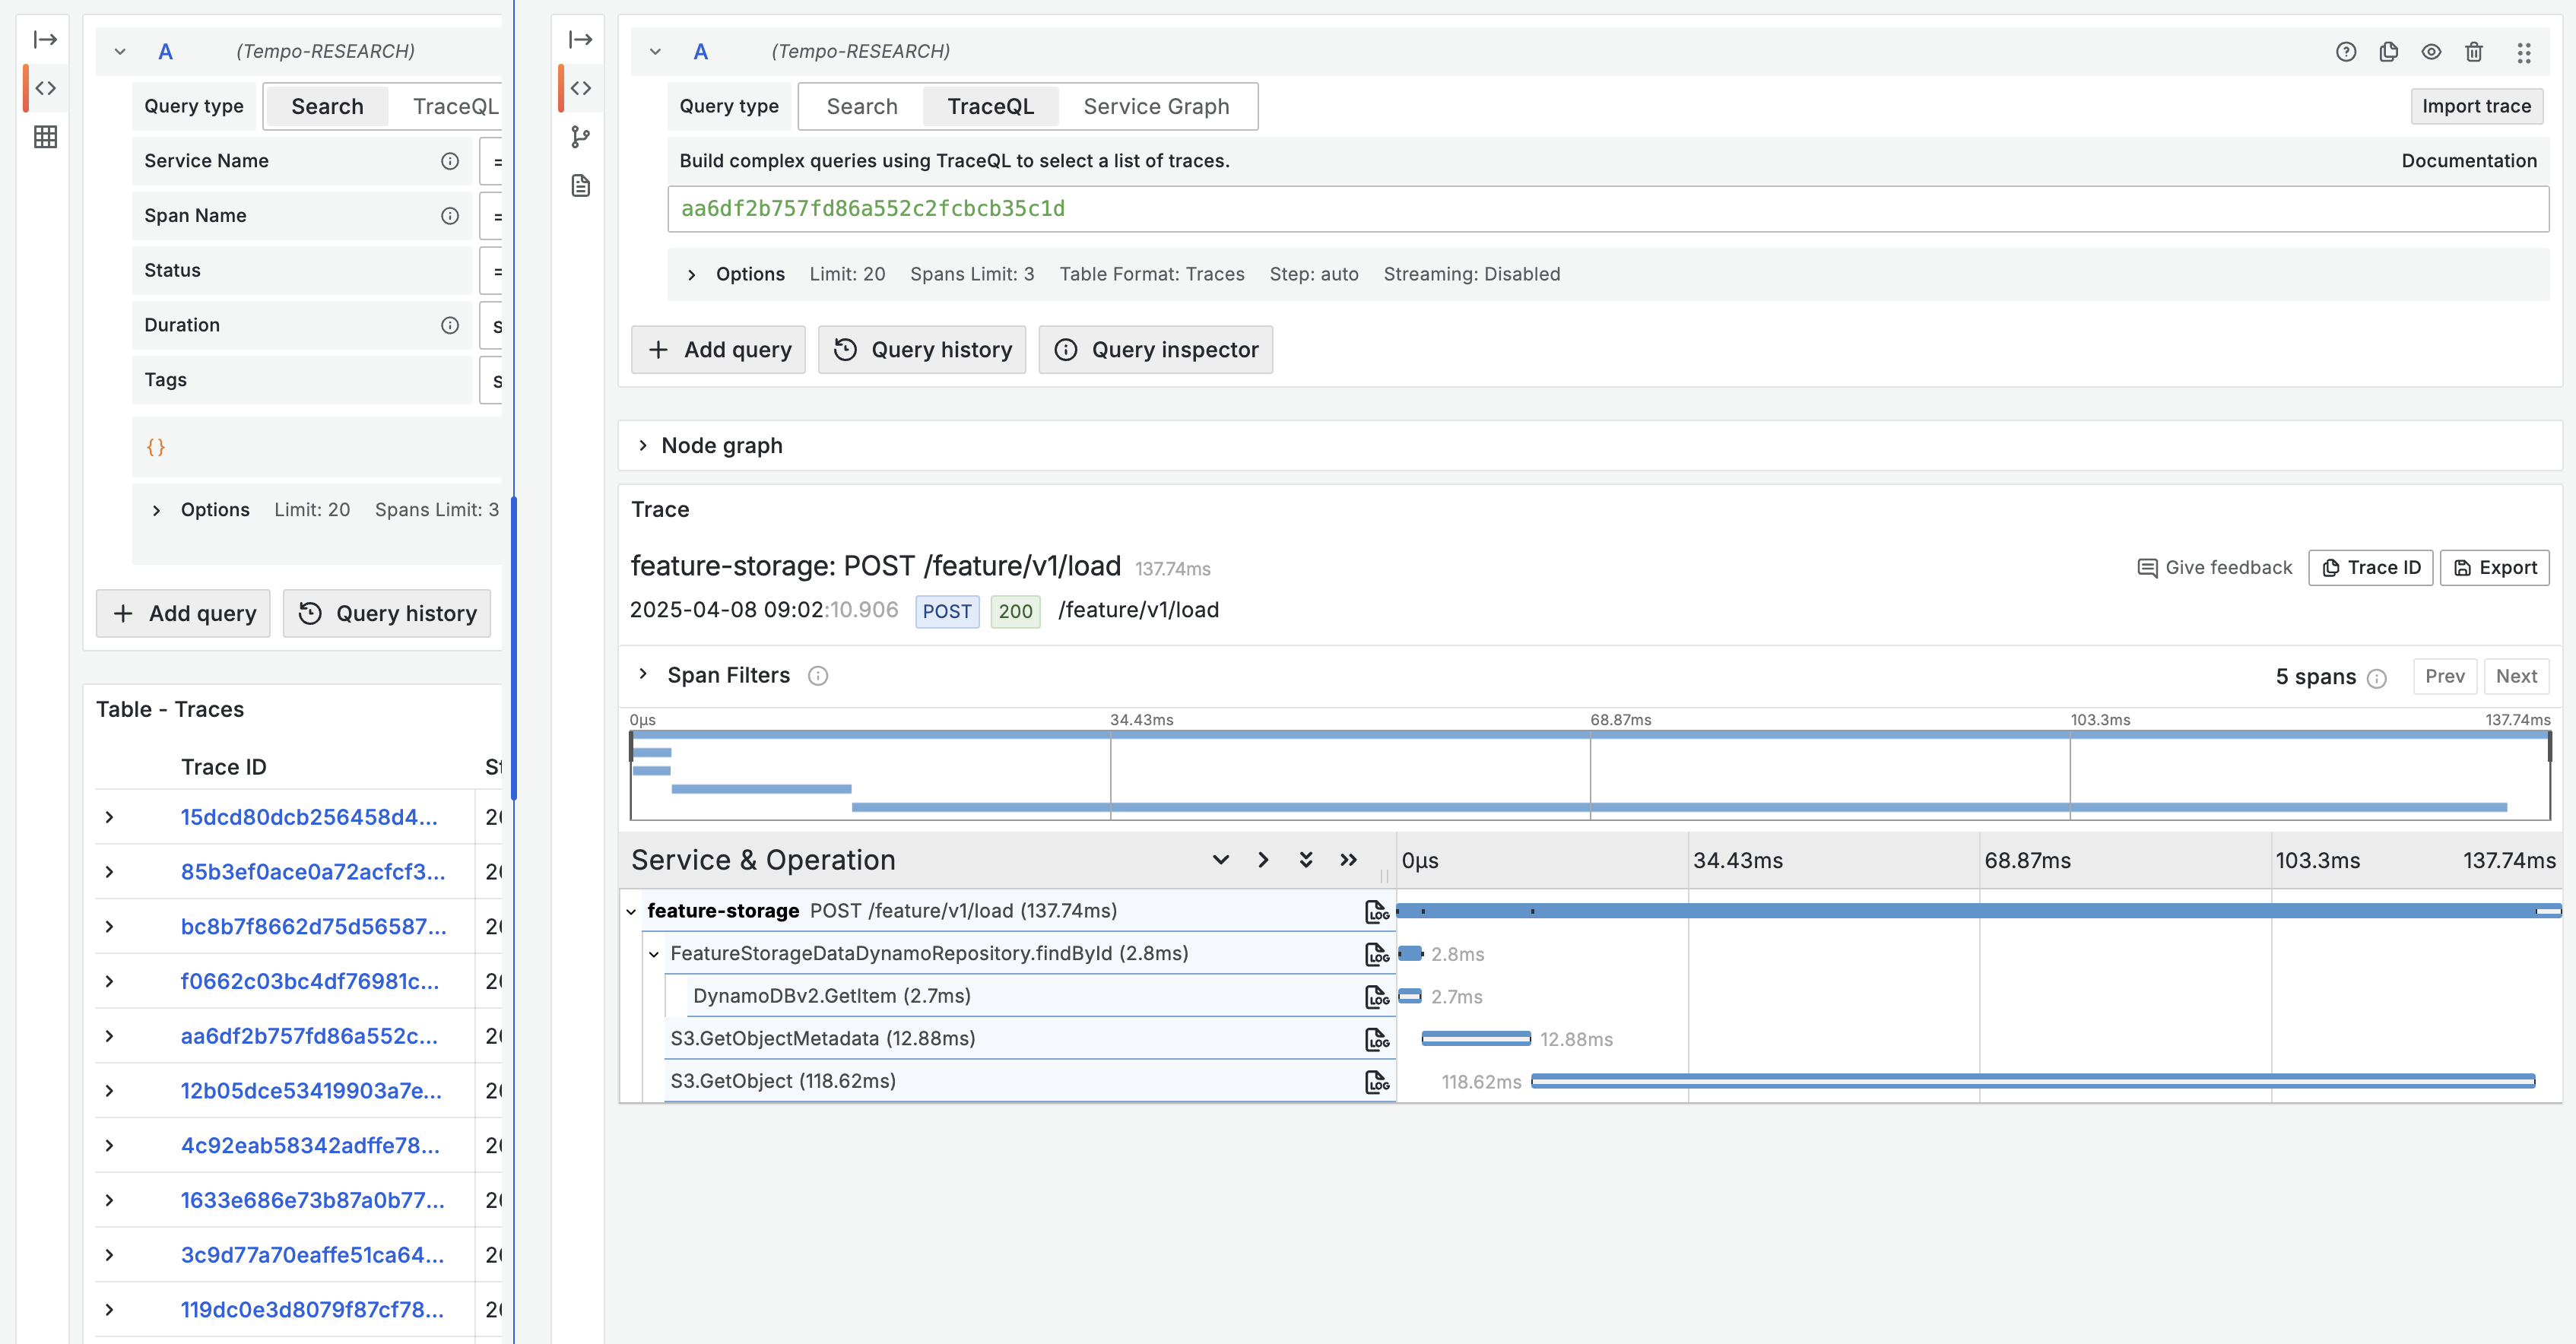
Much like logs and metrics, traces use a distinct query language called TraceQL. You can find the reference for TraceQL here.
Viewing Alerts
AlphaSense includes SLI, SLO, and alert definitions for each microservice. By default, there is no
integration from the alerting system to external notification systems like PagerDuty or OpsGenie.
Nevertheless, you can still monitor the alert state on Grafana. The dashboard for alert status can
be found under Alertmanager/Alerts Summary.
