General Troubleshooting
Overview: Troubleshooting Strategies
In troubleshooting scenarios within our product, we offer two primary approaches: utilizing the evolving Grafana dashboards (including the "System Health - Service Overview" dashboard and Kubernetes health metrics) and employing kubectl commands for a deeper dive into microservice health.
System Health - Service Overview Grafana Dashboard
To provide an initial status check on various features, please refer to the "System Health - Service Overview" dashboard in Grafana.
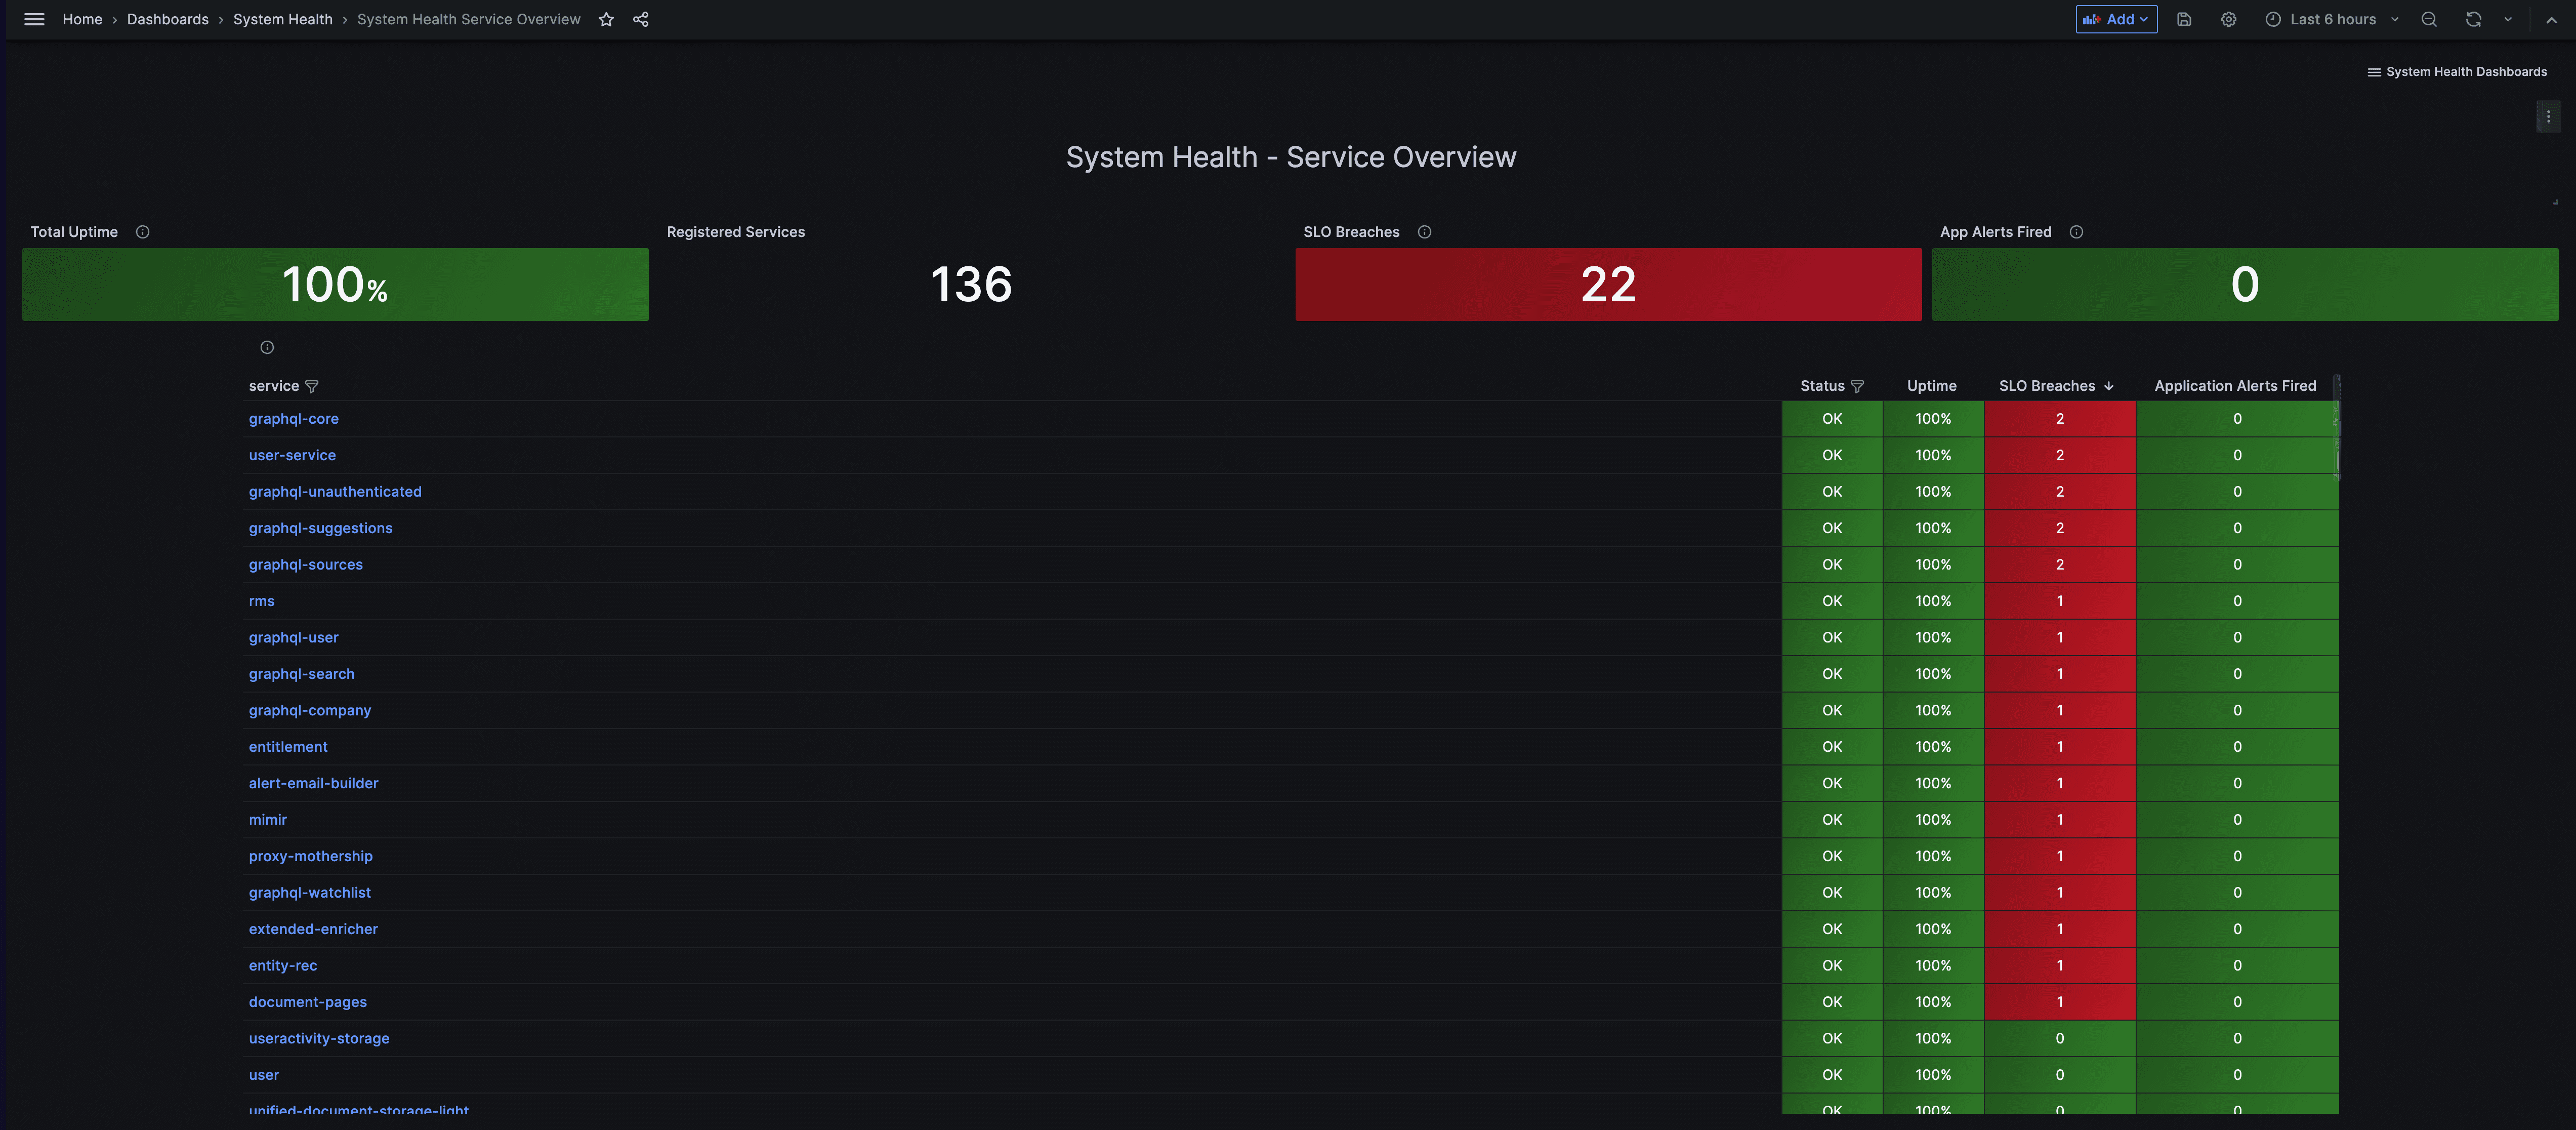
This dashboard serves as a centralized tool for viewing the status of key features within our product. While we are gradually expanding Grafana's capabilities for in-depth troubleshooting across the stack, it may not cover all features comprehensively.
Kubernetes Health Metrics Grafana Dashboard
To provide a more detailed view of the Kubernetes cluster health metrics, please refer to the "Kubernetes Cluster Health Metrics" dashboard in Grafana.
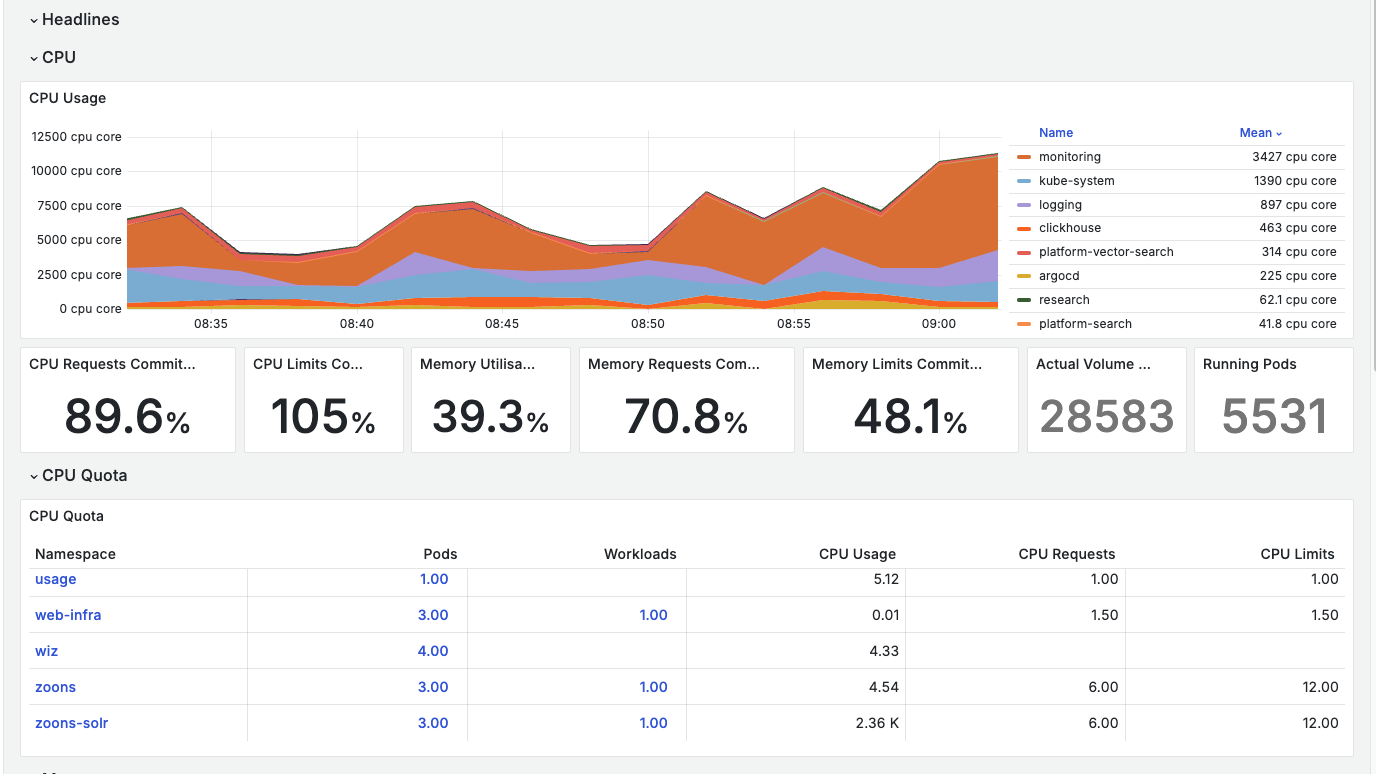
This dashboard serves as a centralized tool for viewing the metrics of Kubernetes cluster where the application is running. It features hierarchical resource visualization that provides multi-level resource monitoring from Cluster → Namespace → Workload → Pods, enabling efficient drill-down/up navigation.
Using kubectl for Troubleshooting
In cases where the Grafana dashboard doesn't yet encompass a specific feature, kubectl commands become pivotal for assessing the health of microservices. This approach allows you to gather real-time information about the status and performance of individual features, aiding in the troubleshooting process.
By integrating these strategies, you can efficiently troubleshoot issues, relying on Grafana's evolving capabilities and seamlessly transitioning to kubectl when additional granularity is required. The subsequent sections will guide you through the specific steps for troubleshooting each feature using these approaches.
Using Grafana Dashboard
Prerequisites
- kubectl command line tool. At least version v1.25.16 is required
- A desktop or a laptop computer
- A network browser of your choice (e.g. Google Chome)
Access
Please consult the Observability documentation for information on accessing Grafana.
Usage
These dashboards are designed to allow users to initiate troubleshooting at a broad level and
progressively explore deeper layers. Alongside the Kubernetes Cluster Health Metrics dashboard &
System Health Service Overview dashboard, we offer the Grafana dashboard for monitoring
Kubernetes health metrics and performing deeper analysis of microservice health.
Our troubleshooting approach is designed to start at a broad level and progressively explore deeper layers. We provide multiple dashboards for comprehensive monitoring:
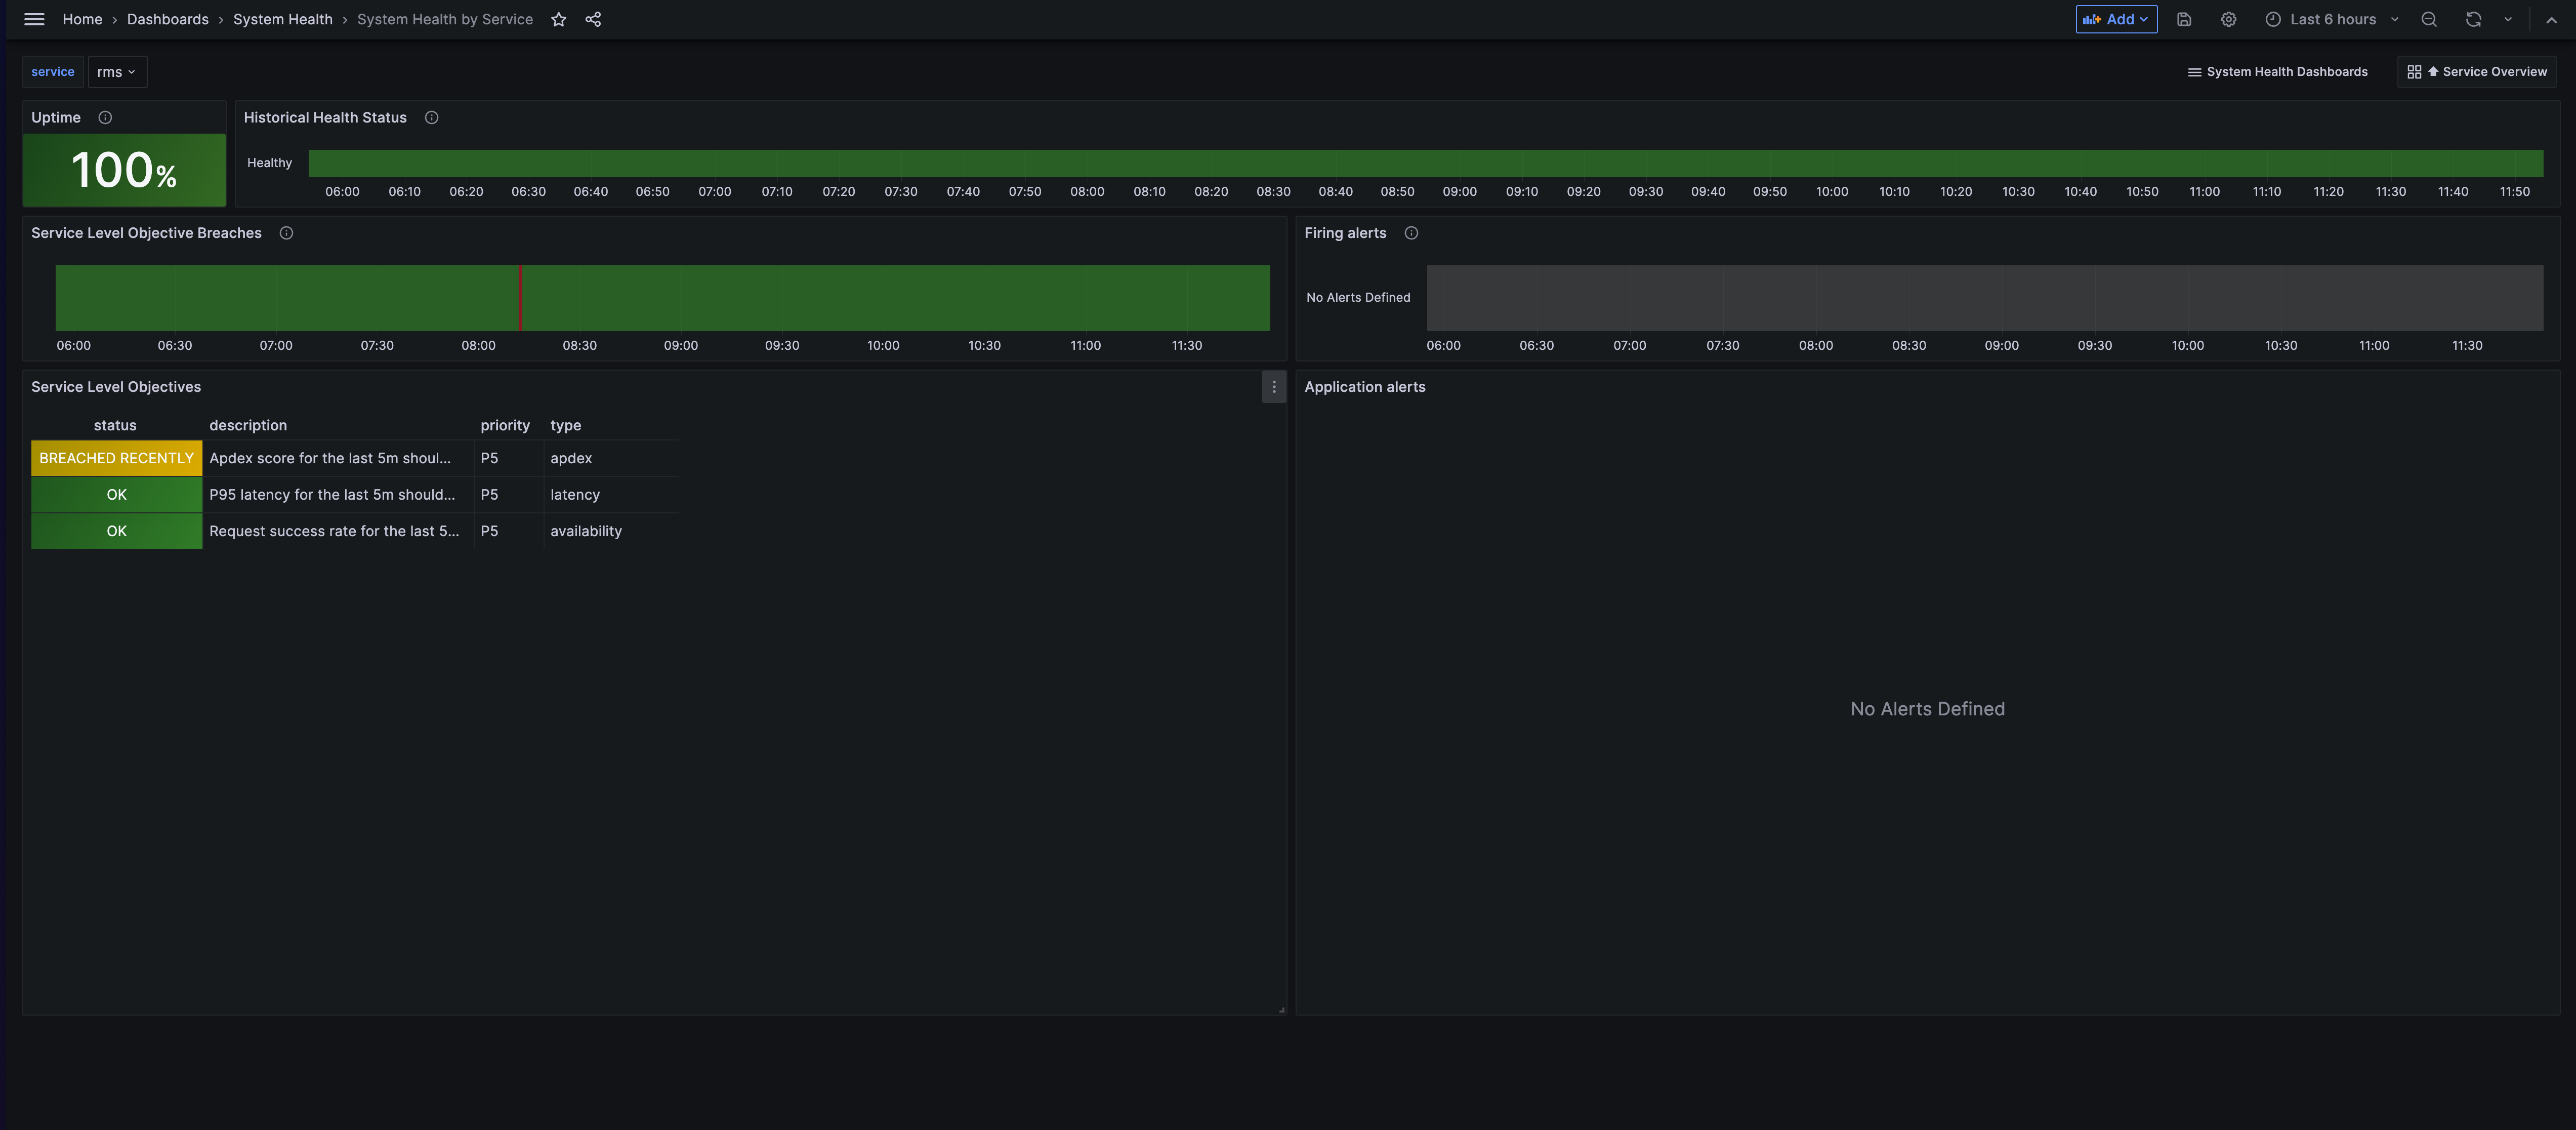
- System Health Service Overview dashboard provides an elevated view of microservice health status.

By interacting with the services on either of the mentioned dashboards, users can seamlessly delve into a more detailed examination of the health status for the selected service.
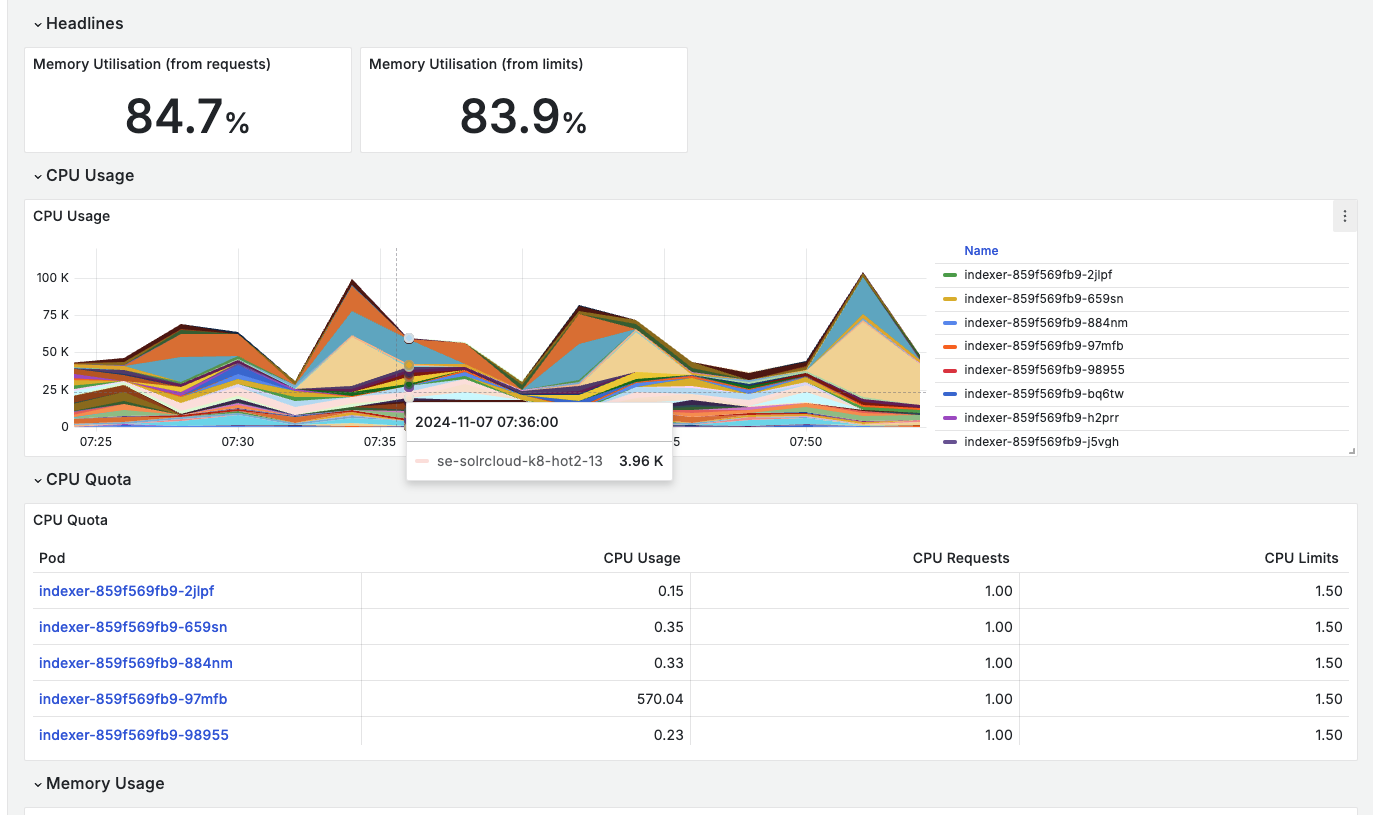
- Kubernetes Cluster Health Metrics dashboard offers detailed cluster-level metrics and resource monitoring.

By interacting with the services on either of the mentioned dashboards, users can seamlessly delve into a more detailed examination of the application's/namespace's status for the selected resource or service.
Presently, this approach is confined to high-level health monitoring. Our ongoing efforts aim to expand this capability, aspiring to make Grafana the sole tool necessary for troubleshooting. During this transitional phase, users are encouraged to employ kubectl for troubleshooting services that fall outside the current Grafana coverage.
Using Kubectl
Prerequisites
- kubectl command line tool. At least version v1.25.16 is required
Usage
Below is the list of useful commands to check for the general health of the system on Kubernetes level at realtime.
specific runbook section :::
Getting non-Running pods
kubectl get pods --all-namespaces -o custom-columns='NAMESPACE:metadata.namespace,POD:metadata.name,READY-true:status.containerStatuses[*].ready,STATUS-PHASE:.status.phase' | grep -v Succeeded | grep false
Get pods that were OOMKilled
kubectl get pods --all-namespaces -o=jsonpath="{range .items[*]}{.metadata.name}{'\t'}{..exitCode}{'\n'}{end}" | grep 137